This paper is available on arxiv under CC BY-NC-ND 4.0 DEED license.
Authors:
(1) Akash Chikhalikar, Graduate School of Engineering, Department of Robotics, Tohoku University;
(2) Ankit A. Ravankar, Graduate School of Engineering, Department of Robotics, Tohoku University;
(3) Jose Victorio Salazar Luces, Graduate School of Engineering, Department of Robotics, Tohoku University;
(4) Yasuhisa Hirata, Graduate School of Engineering, Department of Robotics, Tohoku University.
Table of Links
- Abstract & Introduction
- Related Work
- Semantic Mapping Framework
- Multi-Target Search
- Experimental Studies
- Conclusions and Discussions, Acknowledgment and References
V. EXPERIMENTAL STUDIES
The following section describes the experimental details, starting with hardware configuration, followed by quantitative results and analysis.
A. Hardware Configuration
We use a Turtlebot2 platform with Kobuki base for our experiments. The onboard sensors include a RGB-D camera (Azure Kinect), a laser range scanner (RPLIDAR S2). The encoder information from the robot base is used to compute the odometry. The data acquisition from sensors and command relay to the robot is performed on the NVIDIA Jetson AGX Xavier as the client. The backend computations as well as the frontend visualization were carried out on a server CPU with NVIDIA 3090RTX graphics unit with an i9-12900K processor. The ROS distributed computing network ensured time synchronized communication between the server and the client.
B. Living Lab- Simulated indoor environment
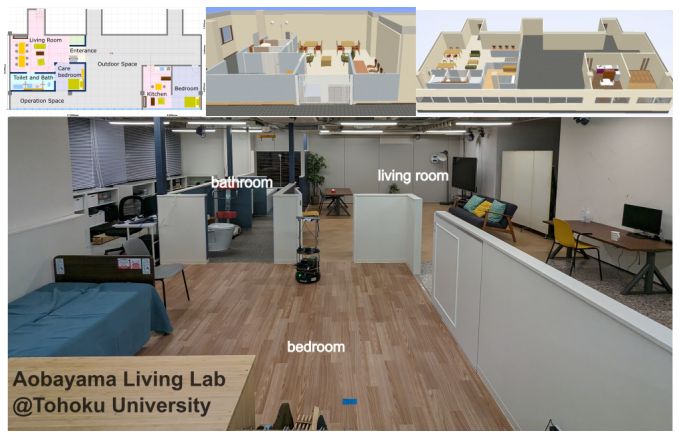
All tests were performed in a simulated indoor environment called the ‘Aobayama Living Lab’ [2] at Tohoku University. The goal is to create a concept for future welfare facilities, as shown in Fig. 5. The Living Lab included household objects such as tables, chairs, sofas, beds, TVs, lamps, and cabinets. The facility emulates various areas, including toilets, bathrooms, kitchens as well as an outdoor environment with stairs, slopes, and rough terrain. The dataset generated from the Living Lab will be used to facilitate long-term navigation for service robots.


C. Experimental Setup
We conducted numerous experiments with different initial positions to understand the influence of our heuristic and navigation strategies. Each data point shown in the next subsection is obtained after averaging the results of five tests conducted in every scenario. Averaging eliminates any bias due to the slight randomness of the path planners and the minor differences in the starting positions (< 5cm) in each run. The distance traveled and the time required for the robot to search each target is recorded. The positions of the targets, i.e., cup and remote, are kept unchanged.
D. Results and Analysis
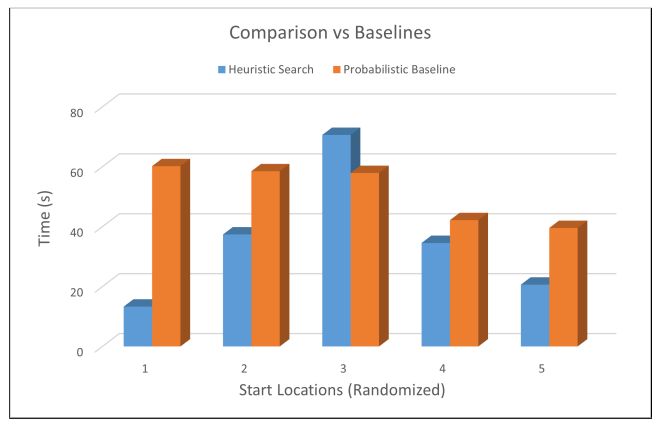
The results are divided into two groups. In the first part, we compare the performance of our novel heuristic with a baseline probabilistic greedy search. Figure 6 shows the results of a comparative study.

Compared to the baseline, the proposed heuristic led to an average decline of 31.67% in the time taken, and 40.5% decrease in distance travelled to find a cup. Similar reductions of 26.35% and 29.3% were found in time required and distance travelled for searching remote. Thus, our heuristic is significantly superior than probabilistic baselines for multitarget search.
Next, we compare the differences in target search with respect to the priorities set by the user. We initialize the target search from ten random locations in the indoor environment and change the priority of the search for each scenario. The results are shown in Figures 7a and 7b below.
Our studies show that on an average a time reduction of 12.05s (33.5%) is observed when the user prioritizes finding the cup. In case of prioritising remote, a time reduction of 10.5s (26.5%). observed when compared with an equal priority search. When the user prioritises cup, the first-hit (i.e finding the target at the first landmark visited) percentage was 60% as compared to 40% for a equal-priority search. The cumulative time spent increased by 8.94s when prioritising remote and by 4.13s when prioritising cup as compared to equal priority search. Additionally, if the robot were to prioritize finding the remote, it took 25.8s more than the equal priority search to find the cup. Thus, it can be inferred that if the user intends to save energy or cumulative time rather than find one target at the earliest, an equal priority directive should be given.

We assess the distance efficiency of our search strategy by calculating the Success weighted by Path Length (SPL) metric as follows:

L = Length of path followed by Robot
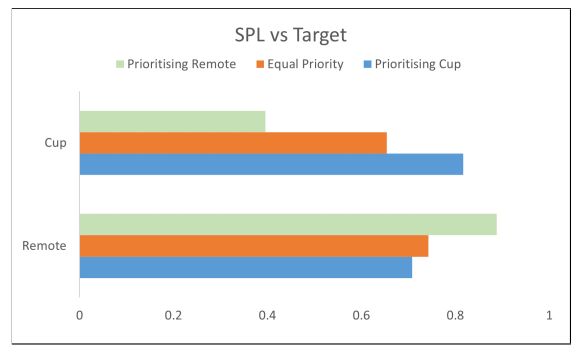
Figure 8 shows the SPL for target search (for both targets) depending on the priority set by the user.

It is observed that the SPL increases by 0.16 (24.84%) when the user tasks the robot to search for a cup with priority, as compared to an equal priority search. An increase of 0.14 (19.5%) in the SPL is observed when prioritsing remote in the target search. In a cross-analysis, it is seen that the SPL decreases by 0.18 (20.2%) while searching for remote and 0.42 (51.5%) while searching for cup if the user prioritizes searching for the other object. The sharper SPL decline for cup can be attributed to its real location being closer to multiple landmarks as opposed to the remote.

